Introduction: 2026—Global Trade Enters a "Geopolitical Premium" New Normal
Looking back from April 2026, the global ocean freight market is no longer the simple "bulk transportation tool" it once was. With the prolongation of geopolitical conflicts, the layering of global tariff barriers, and the AI-driven precision supply chain revolution, shipping costs and efficiency have become core metrics affecting Taiwan’s cost of living and corporate competitiveness.
From imported fruits on supermarket shelves to 3C products on cross-border e-commerce platforms, every piece of cargo hides complex route planning, tariff maneuvering, and digitalized actuarial calculations. From a professional freight forwarding perspective, this article analyzes the five most critical shifts to help businesses and consumers find a clear roadmap in this turbulent 2026.

Chapter 1: Global Tariff Policy Reconstruction — The End of the "Tax-Free Parcel" Era
Over the past decade, the boom of cross-border e-commerce was largely built on the "de minimis threshold" (tax-free limit) for low-value parcels in various countries. However, entering 2026, this protective umbrella has completely collapsed.
New Tariff Walls in the US and EU
In early 2026, the US officially implemented amendments to the Trade Integrity Act targeting cross-border parcels, completely eliminating the previous $800 tax-free allowance. This means that every single order—whether shipped from Temu, Shein, or Amazon’s overseas warehouses—is now subject to import duties.
Simultaneously, the EU has fully implemented the upgraded IOSS (Import One-Stop Shop), removing the tax exemption for items under €22 and imposing higher Carbon Border Adjustment Mechanism (CBAM) fees on digital trade.
Real Impact on Taiwanese Consumers
For those accustomed to shopping on Taobao, South Korean online stores, or high-end European/American e-commerce sites, the most direct feeling in 2026 is that "overseas shopping has become more expensive." Beyond the product price, tariffs, processing fees, and frequent customs delays mean the previous "low-cost dividend" has vanished.
[Table 1: Changes in Cost Structure of Mainstream Cross-border E-commerce Parcels in 2026]
| Cost Item | Pre-2024 (Old System) | April 2026 (New System) | Reason for Increase/Change |
|---|---|---|---|
| Import Duty | Tax-free (below threshold) | 5% - 15% (varies by category) | Total abolition of de minimis threshold |
| Customs Fees | NTD 30 - 50 | NTD 100 - 150 | Strict inspections & digital filing costs |
| Carbon Tax (CBAM) | 0 | 1% - 3% (Estimated) | Global green supply chain requirements |
| Clearance Time | 1 - 2 days | 3 - 5 days | Inspection rates increased to over 30% |
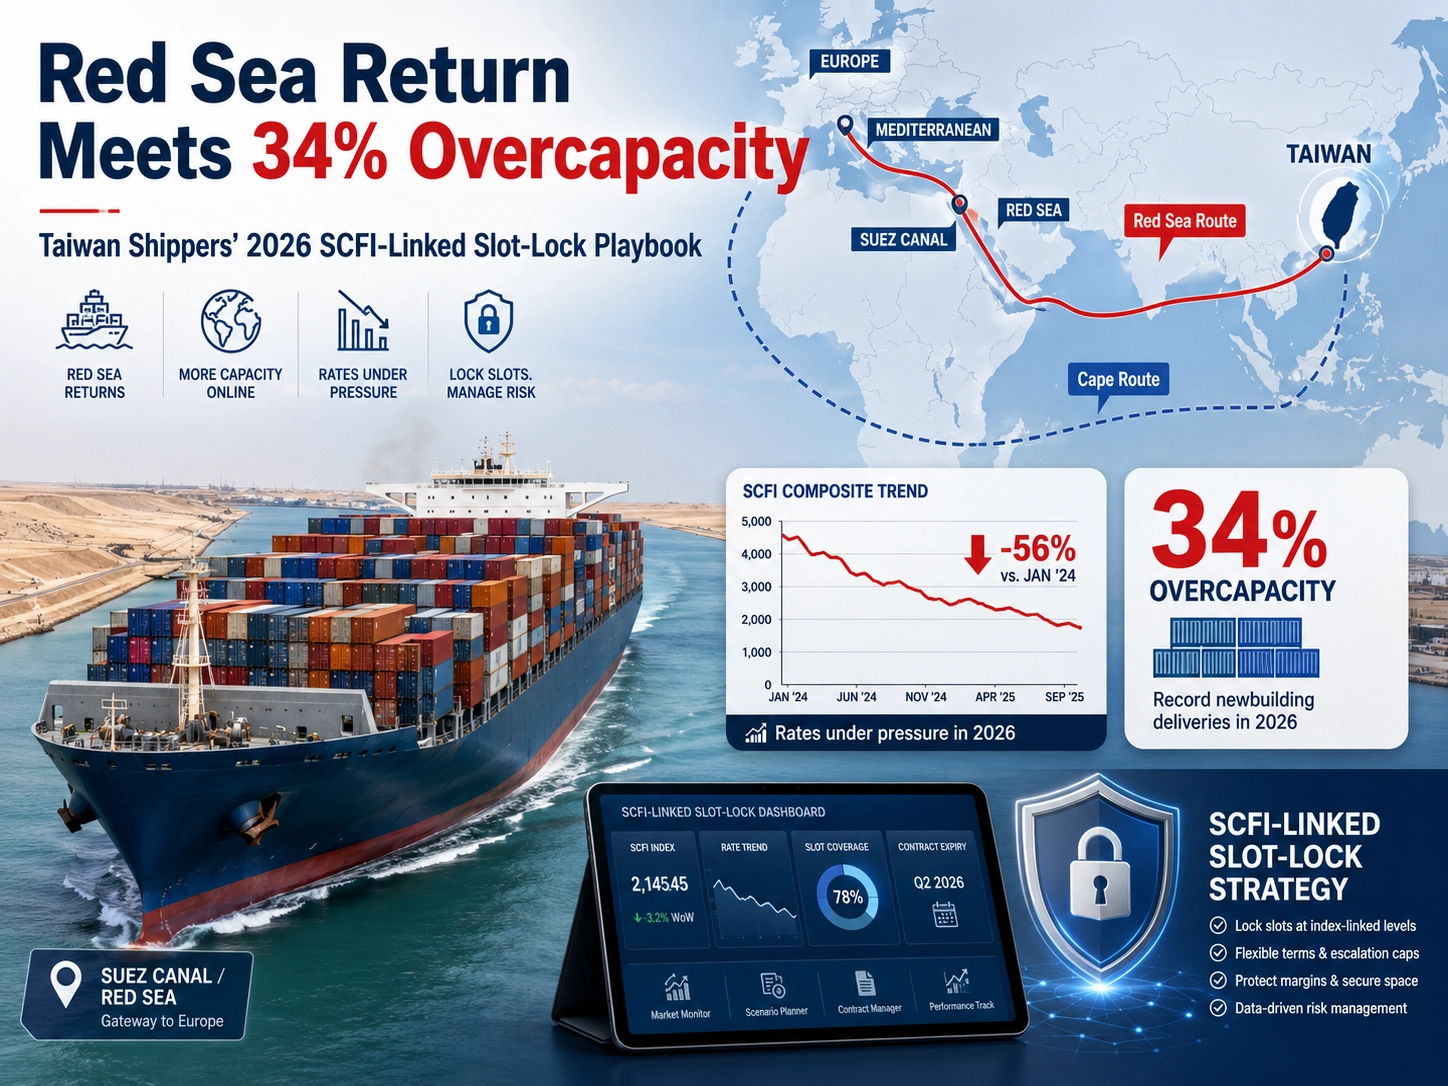
Chapter 2: Normalization of the Red Sea Crisis — The Cape of Good Hope Route as the "New Normal"
The Red Sea crisis that erupted in late 2023 did not dissipate as expected by 2026. Suez Canal throughput remains restricted, and global carriers have institutionalized the "Cape of Good Hope diversion."
Long-term Extension of Route Distance and Time
Rerouting around the Cape of Good Hope adds approximately 3,500 nautical miles to the Asia-to-Europe journey, extending one-way transit by 10 to 14 days. This isn't just a loss of time; it creates a structural reduction in vessel supply. To maintain weekly frequency, carriers must deploy 15% - 20% extra capacity, which directly pushes up the benchmark freight rates for 2026.
Fuel Costs and Geopolitical Insurance Premiums
The significant increase in fuel consumption due to the longer route, combined with high insurance premiums for war-risk zones, has caused the "Bunker Adjustment Factor (BAF)" in 2026 to decouple from base rates, becoming a highly volatile hidden cost.
[Table 2: Operational Data Comparison: Suez Canal vs. Cape of Good Hope Diversion]
| Metric | Suez Canal Route | Cape of Good Hope Diversion | Impact Analysis |
|---|---|---|---|
| Asia to N. Europe | ~25 Days | ~38 - 40 Days | Inventory turnover dropped by 30% |
| Vessel Operating Cost | Base 100% | 145% - 160% | Supports long-term high freight rates |
| Carbon Emissions | Low | High (40% more fuel) | Greater pressure from "Green Inflation" |
| Safety Risk Rating | High (Missile/Drone threats) | Low (Stable long-distance) | Complete overhaul of insurance structures |
Chapter 3: Shifting Trade Landscapes — The Rise of Southeast Asian Routes
As the "China + 1" strategy reaches maturity in 2026, the center of gravity for global supply chains has clearly shifted southward.
Port Expansion in Vietnam, Malaysia, and Indonesia
In 2026, throughput at Vietnam’s Haiphong and Ho Chi Minh City ports hit record highs for the third consecutive year. With the massive shift of electronics manufacturing and light industry to Southeast Asia, shipping lines have adjusted their routes, allocating over 30% of space originally reserved for Central and South China ports to directly serve the ASEAN region.
Taiwan’s Critical Role in Southeast Asian Routes
Leveraging its superior geographical location, Taiwan has become a vital transshipment hub for "Southeast Asia–North America" and "Southeast Asia–Europe" routes in 2026. Kaohsiung Port’s Terminal 6 and 7 are fully automated, specifically handling LCL (Less than Container Load) and transshipment trade from Southeast Asia, driving the business transformation of Taiwanese logistics providers.
Chapter 4: 2026 Capacity Supply Analysis — Balancing New Deliveries with "Green Scrapping"
According to the latest statistics for April 2026, global new ship deliveries have reached a historical peak. So why haven't freight rates collapsed?
Green Regulations Limiting Effective Capacity
Although a large number of Ultra Large Container Vessels (ULCV) entered service between 2025 and 2026, the International Maritime Organization’s (IMO) new CII (Carbon Intensity Indicator) regulations have taken full effect. Many older vessels, unable to meet carbon emission standards, have been forced into "slow steaming" or sent directly to the scrap yard.
Structural Space Shortages
Capacity distribution in 2026 is polarized. Trans-Pacific (US lines) and Asia-Europe lines have relatively sufficient space due to the trend toward larger vessels. However, non-mainstream routes—such as South America, West Africa, and parts of the Middle East—suffer from regional space shortages because vessels were diverted to fill the gaps created by the Red Sea rerouting.
Chapter 5: AI and Digitalization — The "Brain" Revolution in Logistics Decision-making
Precision ETA Forecasting
In the past, "when the ship arrives" was an estimate. But in 2026, through satellite remote sensing and AI simulation, carriers like Evergreen and Yang Ming can provide precision forecasts with an error margin of less than 4 hours. This is revolutionary for inventory management in brick-and-mortar retail.
Digital Freight Platforms and Automated Customs Clearance
In 2026, over 60% of SMEs no longer book space by calling traditional forwarders but use digital platforms instead. These platforms integrate real-time freight quotes, automated tariff calculations, and online insurance, significantly lowering the entry barrier for cross-border logistics.
Chapter 6: Three "Hedging Strategies" for Taiwanese Enterprises and Consumers
Faced with the complex shipping environment of 2026, both brand owners and individual consumers need a new mindset.
Shift Sourcing from JIT to JIC
The past pursuit of "Just-in-Time (JIT)" must now shift to "Just-in-Case (JIC)." Businesses need to establish 3 to 6 months of safety stock to withstand supply disruptions caused by the Red Sea crisis or sudden tariff changes.
Leverage Multimodal Transportation
In 2026, "Sea-Air" and "Sea-Rail" intermodal solutions have become the norm. For high-value, time-sensitive electronics, companies no longer rely solely on sea freight; they may ship by sea to Dubai or Singapore and then transfer to air for the final leg to Europe. While costs increase, it effectively cuts transit time by more than half.
The "Local Substitution" Trend for Consumers
When cross-border costs become prohibitive, Taiwan-made products or regional sourcing regain their competitiveness. This is not just an economic choice but an inevitable outcome under the trend of sustainable development.
Chapter 7: Deep Dive into 2026 Ocean Freight Cost Data
To provide a more intuitive understanding of the market, we have compiled the most representative cost indicators for April 2026.
[Table 3: 2026 Global Main Route Freight Forecast and Volatility]
| Route Name | 2026 Q2 Avg Price (USD/FEU) | YoY Change (vs. 2025) | Volatility Risk Factors |
|---|---|---|---|
| Asia-Europe (Cape Diversion) | $6,500 - $7,800 | +12% | Middle East situation, EU Carbon Tax |
| US West Coast (WCNA) | $4,200 - $5,000 | -5% | Port automation improving efficiency |
| Southeast Asia (Intra-Asia) | $800 - $1,200 | +25% | Port congestion due to surge in demand |
| Taiwan - Southeast Asia | $400 - $650 | +10% | Strong transshipment demand |
Finding a New Order Amidst Change
The 2026 shipping market is no longer a simple competition on price, but a race of "Resilience." Tightening tariff policies force us to re-examine the cost floor of cross-border trade, while the Red Sea crisis tests the response limits of global supply chains.
For Taiwan, this is an era where crisis and opportunity coexist. While we face rising prices and logistics delays, our strategic position as Asia's core hub is becoming increasingly prominent in the global shipping network. Mastering trends, utilizing digital tools, and flexibly adjusting layouts will be the only keys to navigating the stormy global markets of 2026 with stability.
Data Sources:
- 2026 Global Shipping Intelligence Report
- WCO (World Customs Organization) 2026 Tariff Update
- Maritime Executive - 2026 Green Shipping Compliance Analysis
Looking for more logistics details?
You are welcome to consult Mingsheng International Logistics Co., Ltd.
We are happy to evaluate and provide the most suitable solutions for your business. Feel free to contact our Sales Department directly for inquiries at any time!
Sales Department Contact: Ms. Cheng Tel: +886-2-2507-6368 Ext. 251
Email: [email protected]